← Selected work
Case study 01 / Milk Road

Growing a YouTube audience through data-driven editorial strategy.

At Milk Road, I combine editorial strategy, audience analytics, and creative experimentation to improve the performance of a daily cryptocurrency show.

My approach is built around continuous testing: understanding what motivates viewers to click, identifying what keeps them watching, and turning those insights into better editorial decisions.

Performance data helps me validate hypotheses and refine how we package and structure episodes.

My contributionEditorial strategy · Analytics · Packaging · Creative testing
Period shownMay 2024 – October 2026
FocusAudience growth & creative testing
42K+

YouTube subscribers

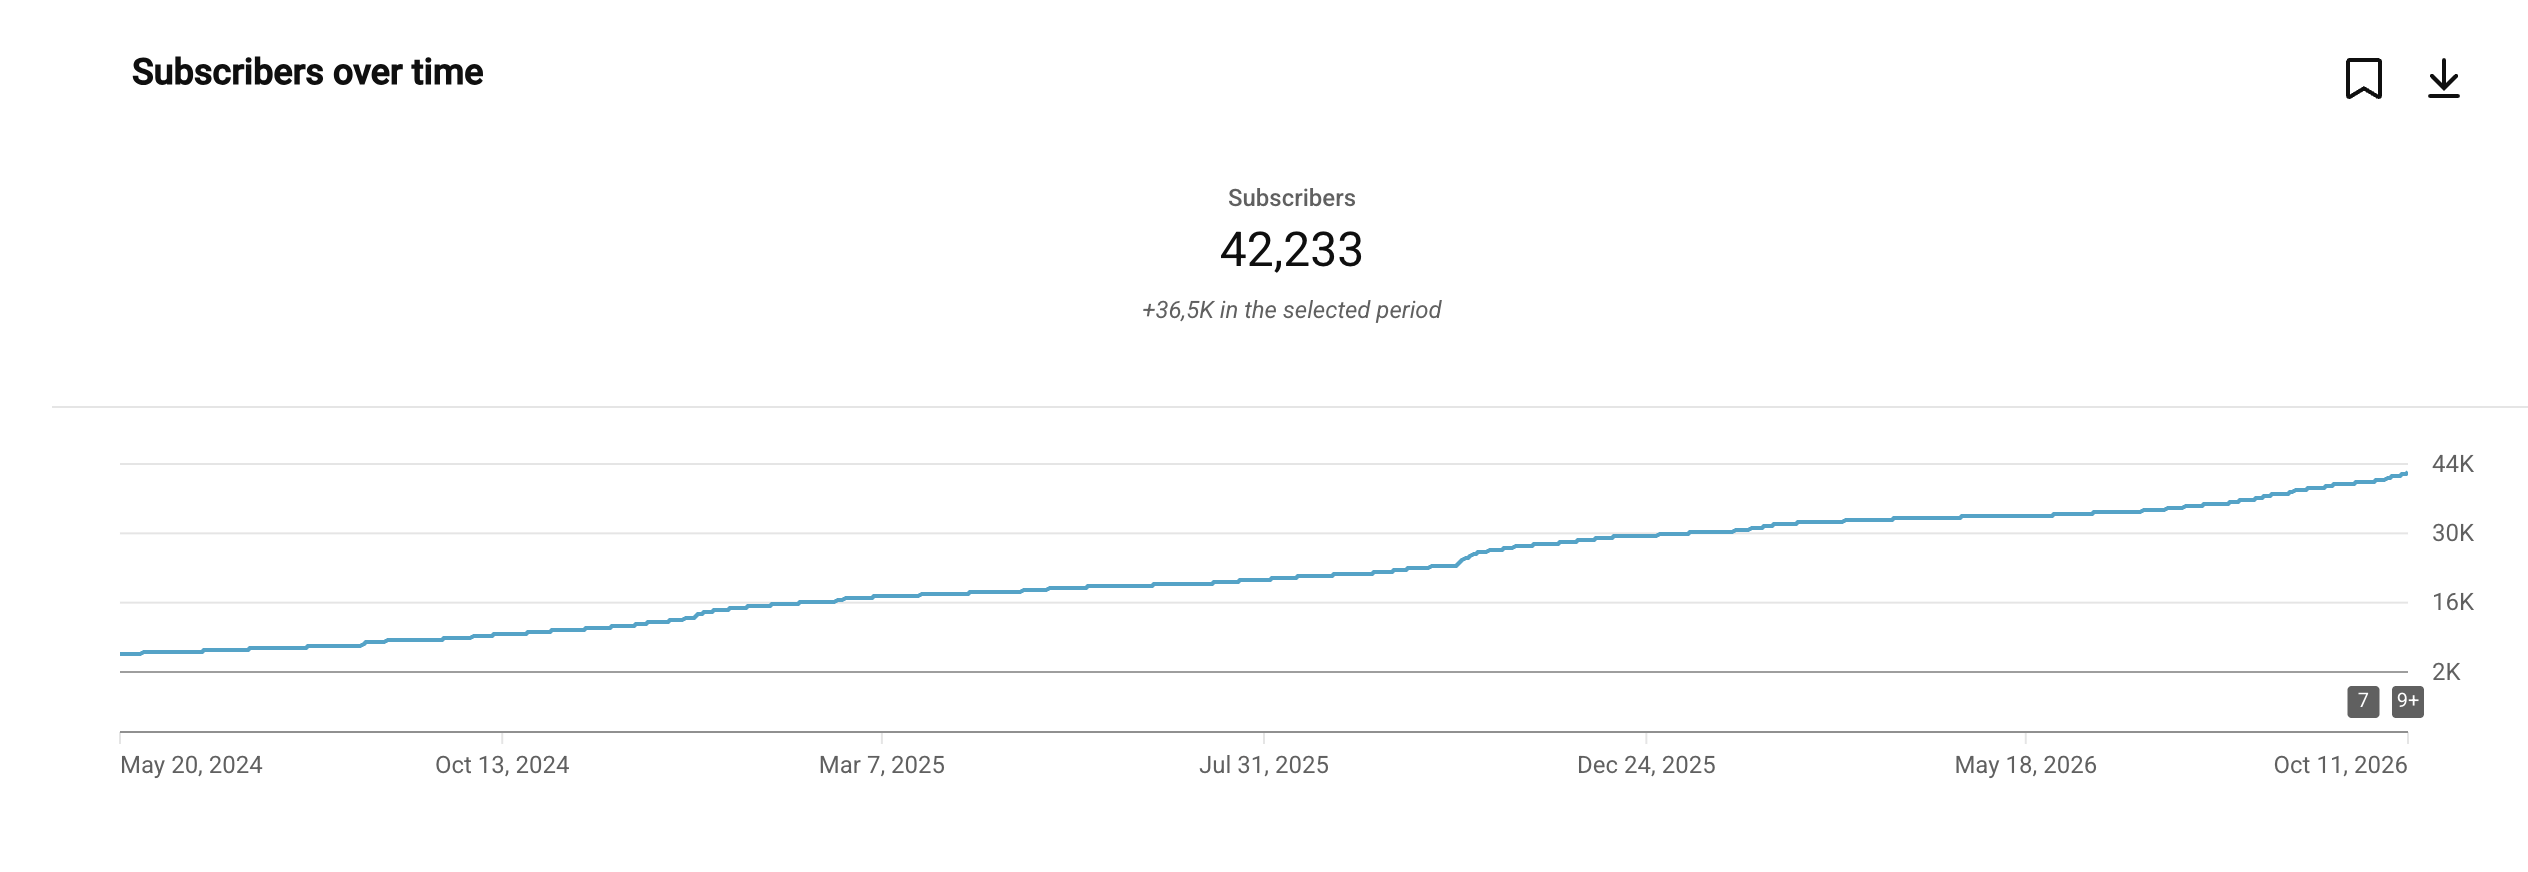
Approximately 5.7K → 42.2K
May 2024 – October 2026

2×+

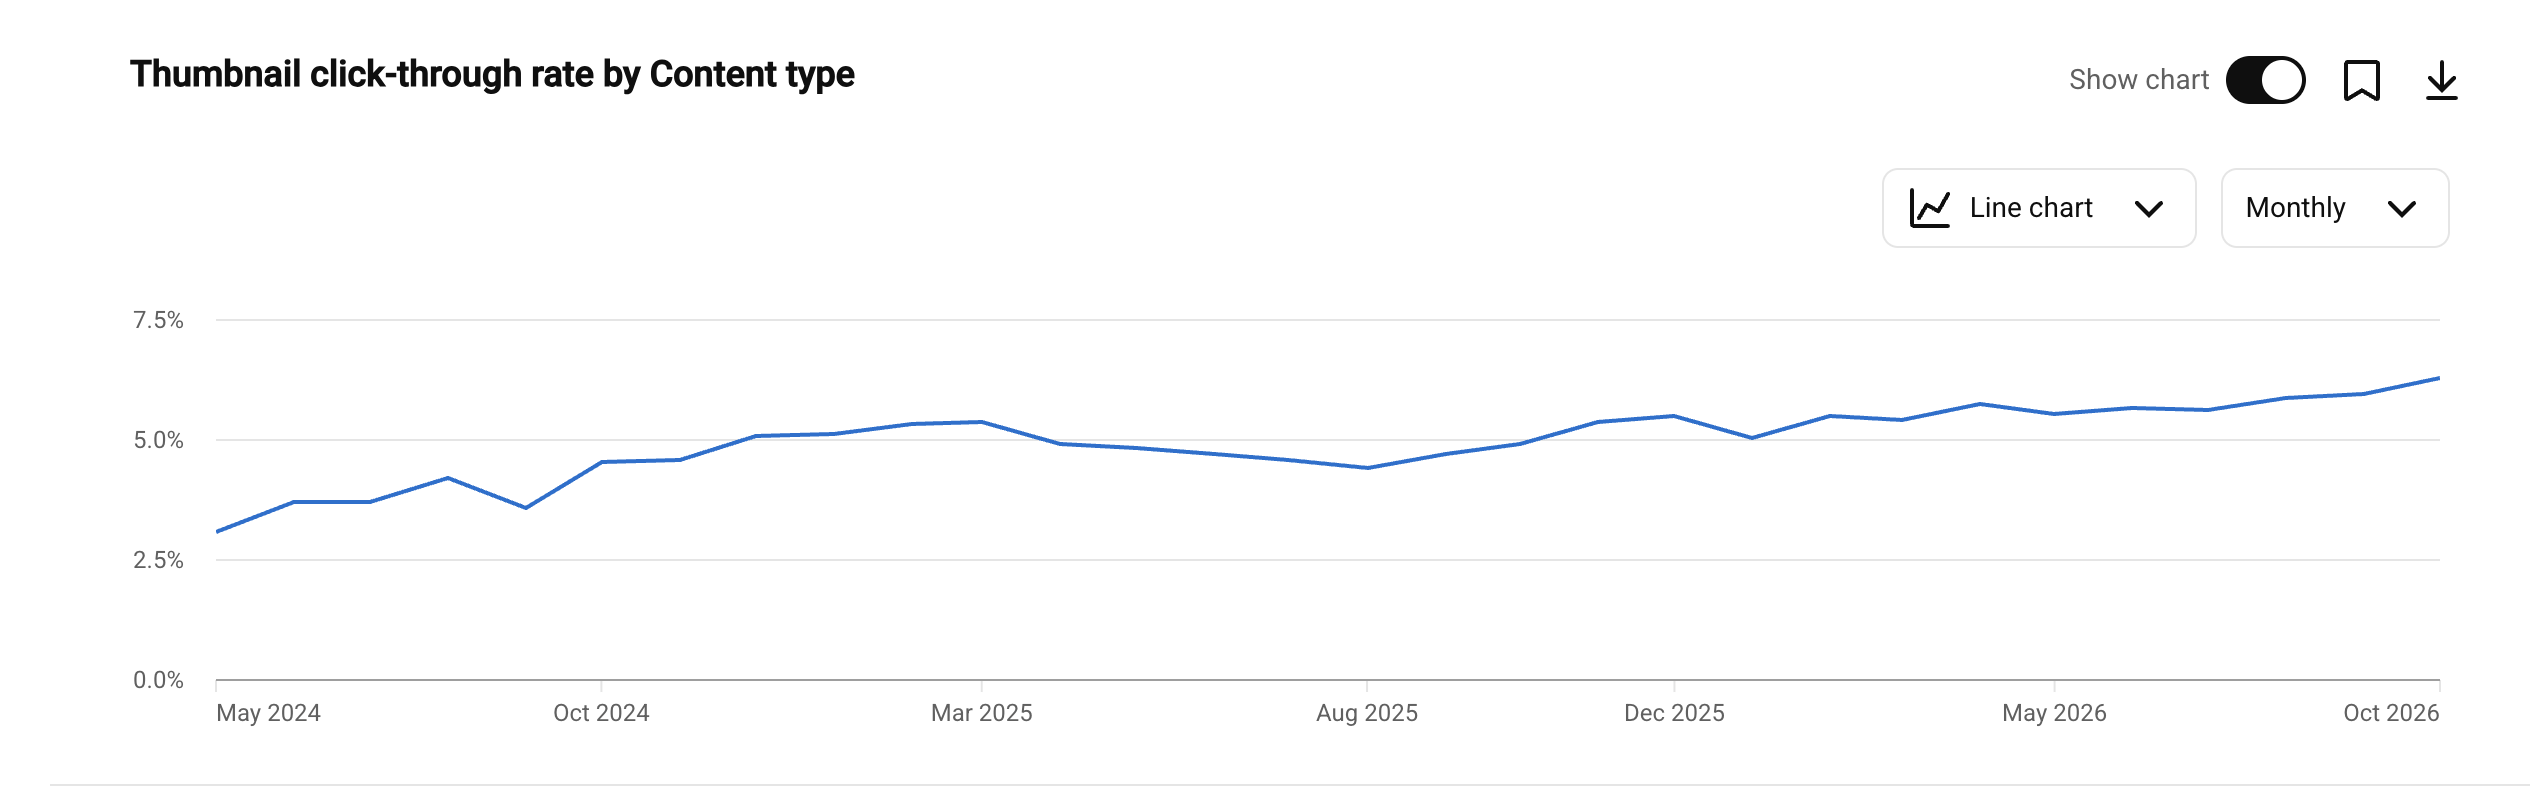
CTR more than doubled

Approximately 3% → more than 6%
Across the period shown

70%+

Introductory retention

Achieved on several recent episodes
Viewers still watching at 0:30

These results reflect collaborative work across the production team. My personal contributions focused on editorial strategy, analytics, packaging, and creative testing.

YouTube Studio subscribers over time: 42,233 subscribers and an increase of 36.5K in the selected period, with the original timeline from May 2024 to October 2026. View full size
01 / The audience over timeOriginal YouTube Studio screenshot supplied by Adrien.42,233 subscribers · +36.5K in the selected period

From 5.7K to over 42K subscribers.

Between May 2024 and October 2026, I contributed to the channel’s editorial development through audience analysis, packaging experiments, content strategy, and production improvements. The chart captures the wider team’s growth across that period.

A hypothesis.
An experiment. A lesson.

I test editorial angles and packaging to learn which promises resonate with the audience. Each result informs the next creative decision.

Test 01

Broad opportunity vs.
a specific cryptocurrency.
Title + thumbnail test
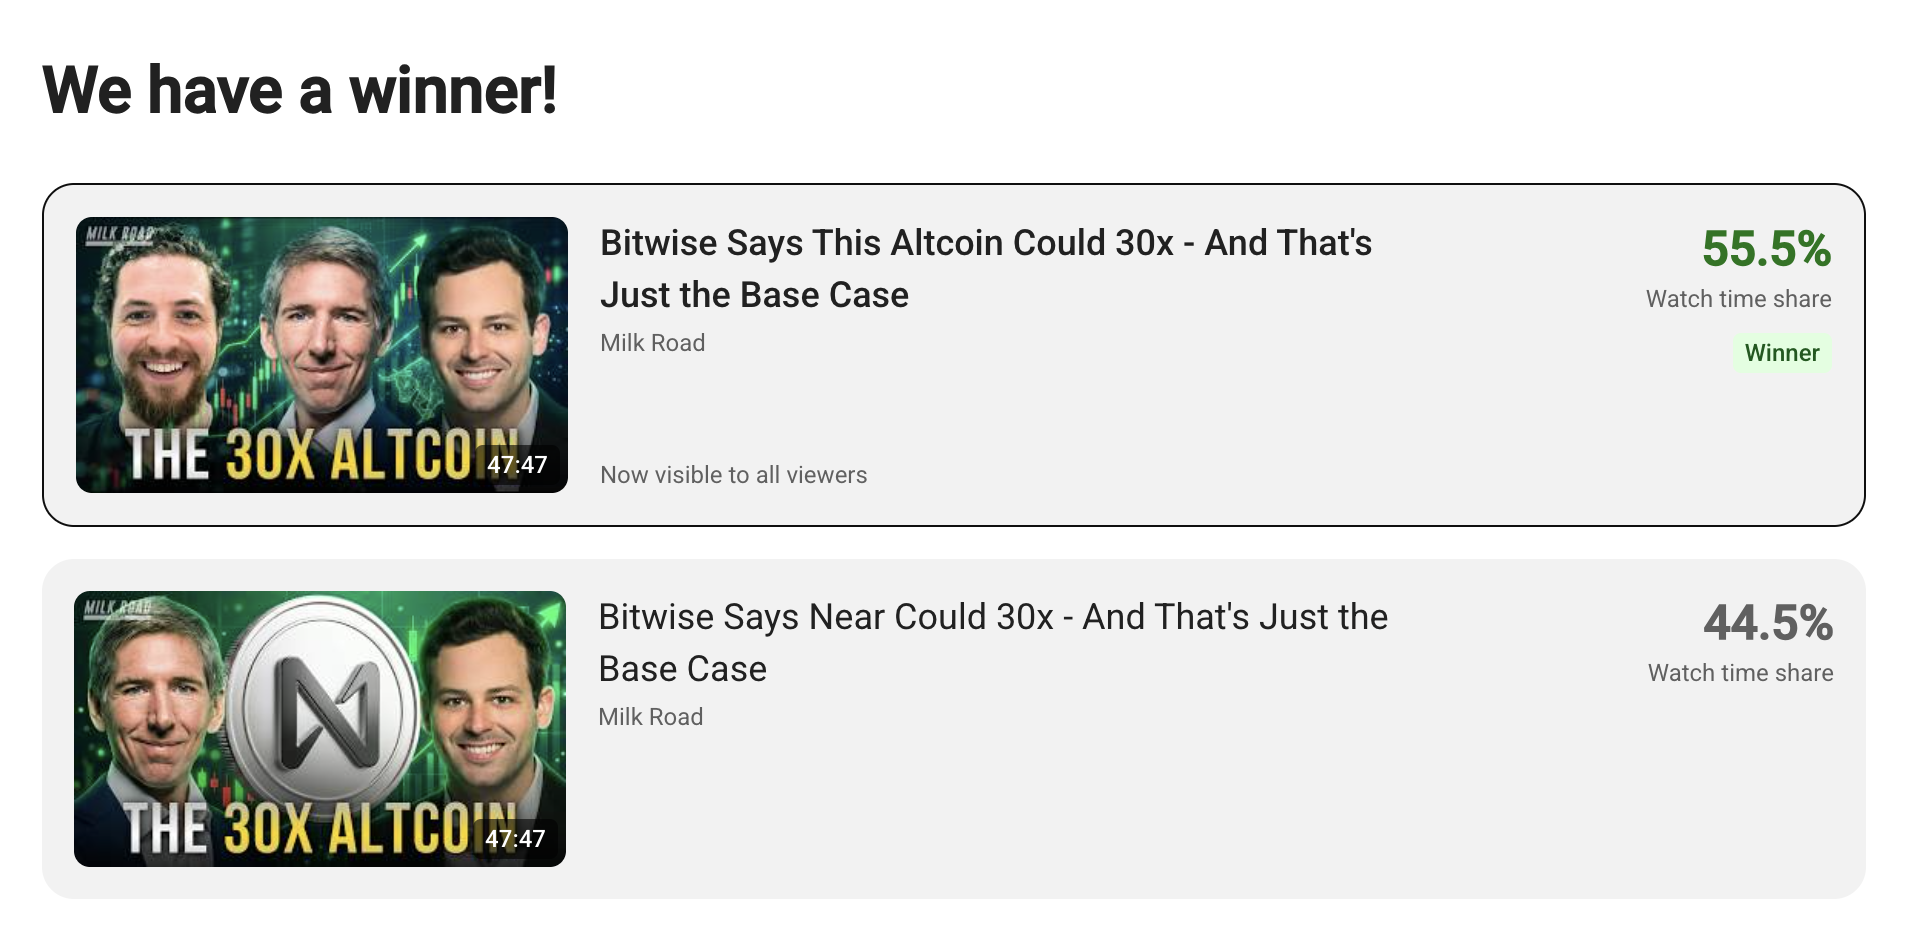
YouTube Studio A/B test: broad altcoin title and three-person thumbnail won with 55.5 percent watch time share, versus 44.5 percent for the NEAR-specific title and token thumbnail. Inspect the test
Original test resultsBoth the title and thumbnail composition differed.
Watch time shareShare of test watch time · not CTR
Broad altcoin framing Winner55.5%
NEAR-specific framing44.5%

Hypothesis

A broader opportunity with significant upside could be more compelling than the name of a specific project.

Creative experiment

I compared an altcoin with potential 30× returns against a version explicitly naming NEAR and featuring its token.

Result

55.5% watch time share

The broader framing won in less than 24 hours.

Lesson

For this episode, emphasizing the broader opportunity performed better than naming the cryptocurrency. The result supported testing audience motivation alongside project recognition.

This was a packaging comparison: the title and thumbnail changed together. The result does not isolate the effect of a single word. Test duration is reported by Adrien; watch time shares are visible in the screenshot.
Test 02

Finding the most
compelling Bitcoin hook.

Three creative approaches
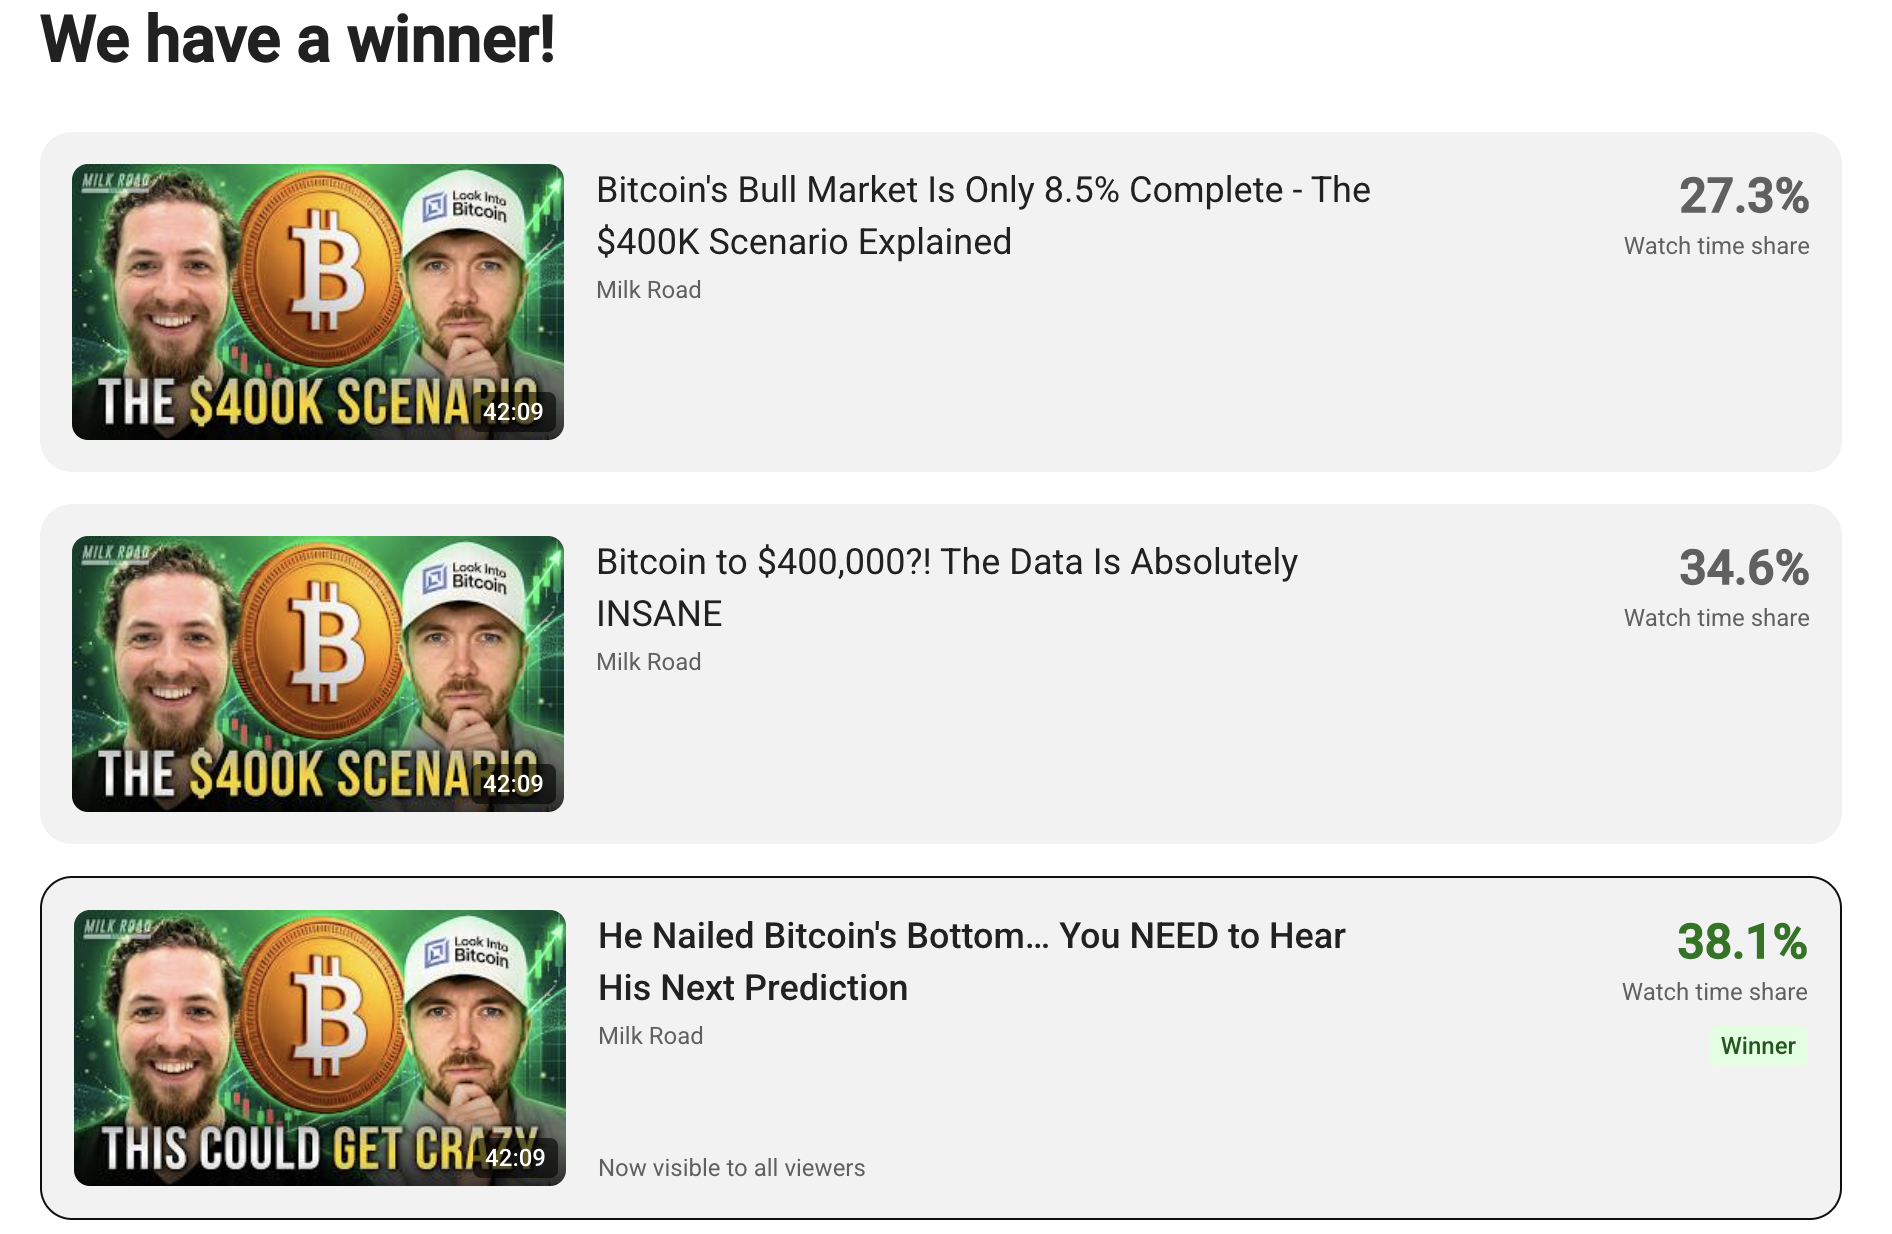
Three original Bitcoin packaging variants: descriptive framing received 27.3 percent watch time share, a bold price prediction 34.6 percent, and credibility and curiosity won with 38.1 percent and a different thumbnail. Compare all three
Original test resultsAll three variants, including the winning thumbnail, remain visible.
Watch time shareShare of test watch time · not CTR
A / Descriptive27.3%
B / Bold prediction34.6%
C / Credibility & curiosity Winner38.1%

Hypothesis

When presenting an ambitious Bitcoin prediction, the editorial angle and title structure could change how compelling the episode feels.

Creative experiment

I tested a descriptive explanation, a bold numerical prediction, and a hook built around the guest’s credibility and the curiosity of what comes next.

Result

38.1% watch time share

Credibility and curiosity won in less than 24 hours.

Lesson

For this episode, establishing credibility and creating curiosity performed better than relying exclusively on a large numerical prediction.

Read the three titles
  1. A / Descriptive · 27.3%“Bitcoin’s Bull Market Is Only 8.5% Complete — The $400K Scenario Explained”
  2. B / Bold prediction · 34.6%“Bitcoin to $400,000?! The Data Is Absolutely INSANE”
  3. C / Credibility & curiosity · 38.1% · Winner“He Nailed Bitcoin’s Bottom... You NEED to Hear His Next Prediction”

The winning version also used a different thumbnail, so this result does not isolate the title’s effect. These percentages are watch time share—not CTR or percentage improvements. Test duration is reported by Adrien.

Improving the
first 30 seconds.

A compelling title and thumbnail can attract viewers. The introduction gives them a reason to stay.

I regularly analyze retention patterns to identify where viewers lose interest and how an opening could work harder.

  • Establish the central idea early.
  • Develop a stronger opening hook.
  • Reduce unnecessary introductory material.
  • Give viewers an immediate reason to keep watching.
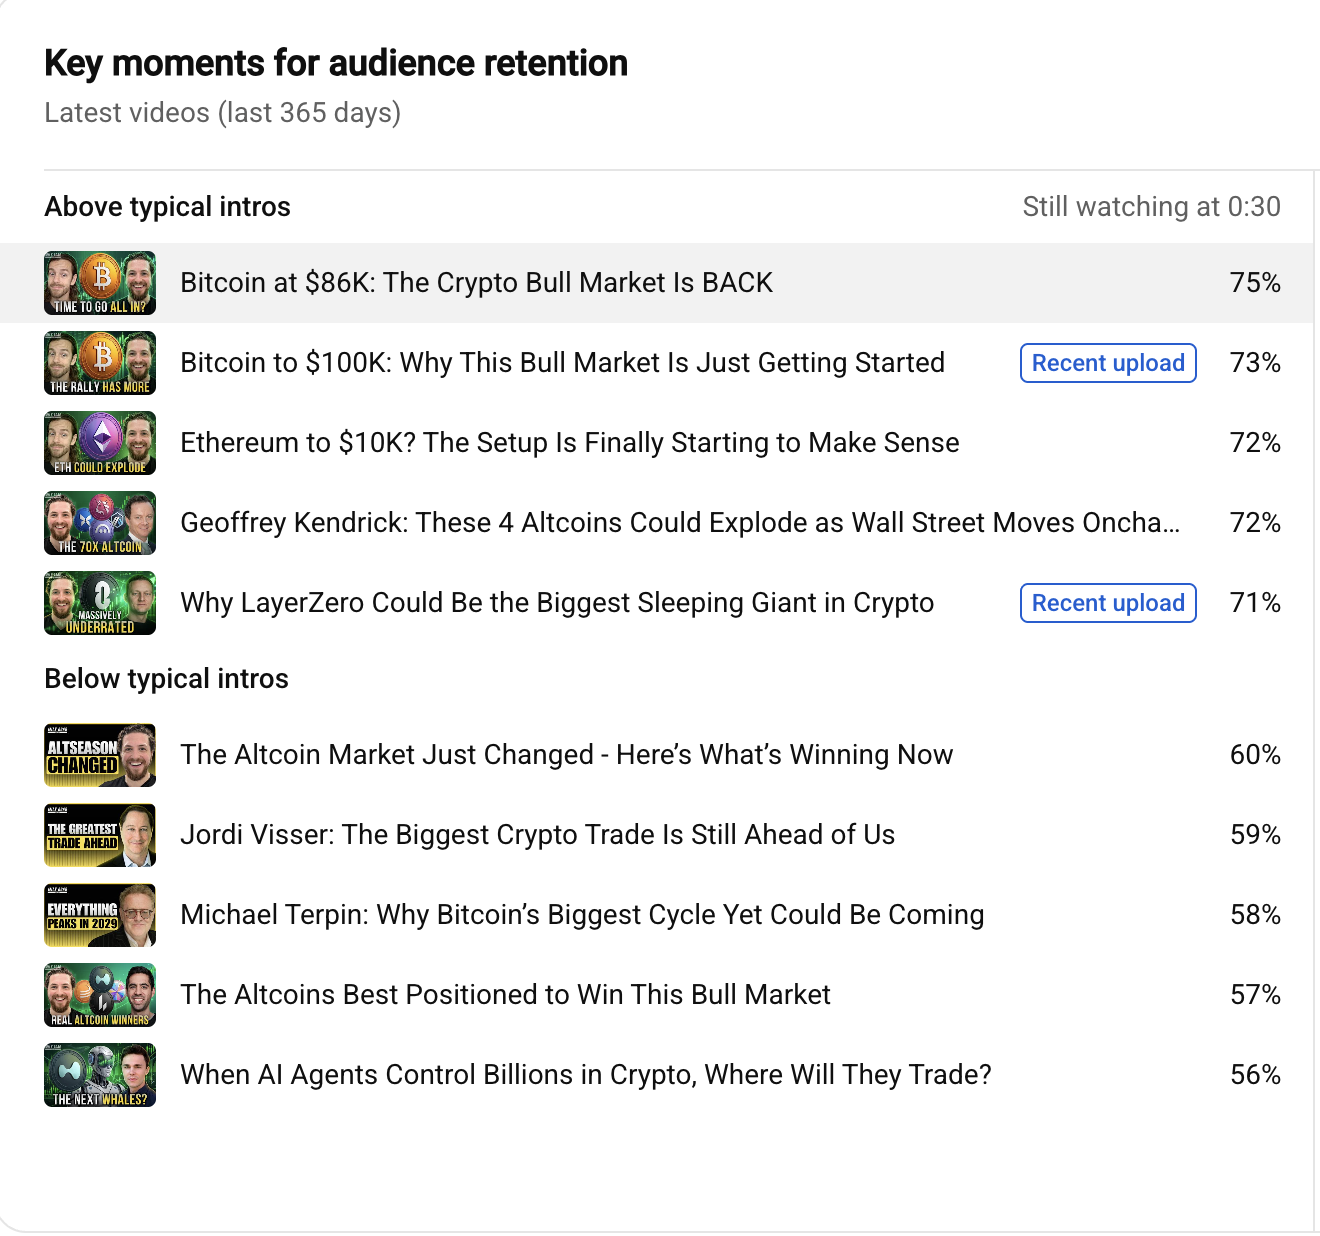
75%Bitcoin at $86K
73%Bitcoin to $100K
72%Ethereum to $10K
71%LayerZero

Selected examples · Viewers still watching at 0:30. The same view includes lower-performing intros at 56–60%. Performance varies by episode; no historical retention uplift is claimed.

Full YouTube Studio retention comparison. Above-typical intros show 75, 73, 72, 72, and 71 percent of viewers still watching at thirty seconds. Below-typical intros show 60, 59, 58, 57, and 56 percent.Read the full comparison
The full pictureOriginal view: latest videos in the last 365 days. Both stronger and weaker intros are shown.

Turning audience insights into
higher click-through rates.

I use A/B testing, performance reviews, and experimentation with editorial angles to improve our episode packaging. Audience behavior informs the next decision.

Original monthly thumbnail click-through rate chart from May 2024 to October 2026, starting around 3 percent and ending above 6 percent, with fluctuations visible throughout.Inspect the original chart
A sustained upward trend, with fluctuationsOriginal monthly timeline and chart proportions preserved.May 2024 – October 2026
Beginning of the period≈3%
End of the periodMore than 6%

Across the period shown, CTR more than doubled. These are approximate readings of the supplied chart, not a claim that any individual test caused the overall increase.

Creative judgment.
Systematic experimentation.

I use performance data to challenge assumptions, understand audience behavior, and continuously improve how content is packaged, structured, and presented.

The goal is to understand what makes content effective and turn those insights into better editorial decisions.

Editorial StrategyAudience DevelopmentCreative TestingPerformance Analytics
Next case study

Independent YouTube channel audit

Original screenshot

Fit to screen. Zoom in to inspect the details.

Open original ↗
Original analytics screenshot